UGU: Unix Guru Universe - spdash
- Home : Software
: PROJECTS
: System Info
: pget
: get
: checksplunk
spdash
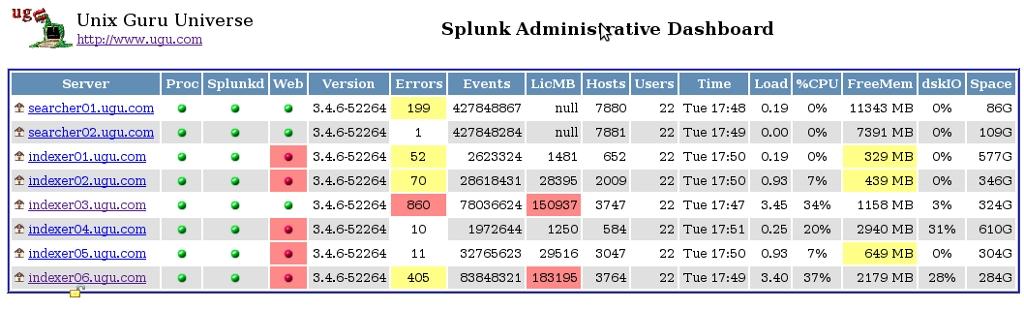
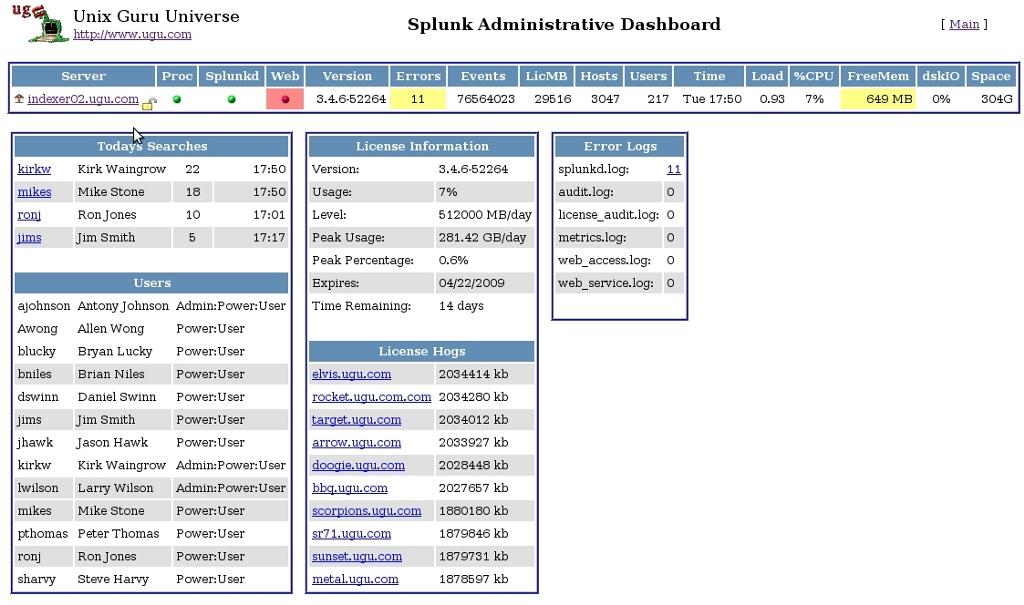
Description: Spdash is a web based dashboard for Splunk Administrators to
monitor Splunk servers. It relies on data collected from
checksplunk.
Features
System Related Output
CPU load (vmstat)
Disk utilization (iostat) on disk with hot/warm db's
Load Average (uptime)
Free memory (meminfo)
Server hostname
Disk size of dbase storage
Current day/time
Seconds since 1970 (See spdash Doc's)
Splunk Related Output
Splunk version
Splunk daemon running (from process table)
Splunkd running (from splunk status)
Splunkweb running (from splunk status)
Number of events indexed
Number of errors in the log files
Display the errors in the log files
Number of hosts
Display indexed hosts
License Information
Number of users accounts created in Splunk
Output user audit logs
Display users with accounts in Splunk
Display the top 10 systems using the largest amount of license in kb
Display number of searches & last access time by users
Build all the SPDASH files needed for web dashboard interface
|
|
Supported Systems: Unix, Linux.
Requirements: Perl and a
commercial version of splunk
Feel free to share and distribute to anyone that can find this useful.
Instructions (Short version):
1) Copy the "spdash" perl script into web servers executable bin (cgi-bin) directory. So the script can be executed by a browser from the URL.
2) Modify the variables at the top of the script to match your environment.
3) It is VERY important that the $STATDIR matches the same path on both checksplunk and spadmin.
4) Collect the data that the dashboard needs to read by running:
# ./checksplunk spdash
Note: Set in a cron for ever 2 min. Spdash will auto refresh every 15 seconds and pick up the changes.
There are 2 pages to spdash. The Main page and the Server page. If spdash only sees one set of collected server files in $STATDIR it will automatically display the server page. If there are multiple sets of collected server files, it will display the main page and you can click into each server to get to the server page.
To create multiple sets of collected server files in $STATDIR, you have 2 option (I prefer option #1):
1) NFS mount $STATDIR from multiple splunk servers that are running checksplunk so they can all write the collected server files into the same $STATDIR directory over the network. If this option is used, then you really don't have to run the web server on a splunk server. It can be ran from any web server that can see $STATDIR. Otherwise, if splunk is running on port 80, then the web server would have to be assigned to another port.
2) Run checksplunk on each splunk server and scp copy the files over to the web server $STATDIR directory. Servers have to be trusted by the web server.
CHANGE LOG:
| V1.0a |
04/2009 |
Bug Fixes
|
| V1.0 |
04/2009 |
First realease.
|
|
 Home
Home